Estimation Execution Control
GridQube CORE has been developed for multiple application scenarios and offers Distribution System State Estimation (GridQube DSSE) for both timeline and real-time analysis.
Time series analysis can be used to process pre-recorded time series of measurement data (e.g. for network performance assessment) or externally generated forecasts and scenario data.
Real-time analysis can be used for scheduled execution on data as it becomes available.
Both modes provide complete network visibility for all modelled network levels and can ingest a wide variety of measurement data, from traditional SCADA to additional network monitoring devices, down to the individual premise where AMI, or similar data device data is collected.
Integration for automated measurement retrieval can be implemented for arbitrary data sources, including OSIsoft PI.
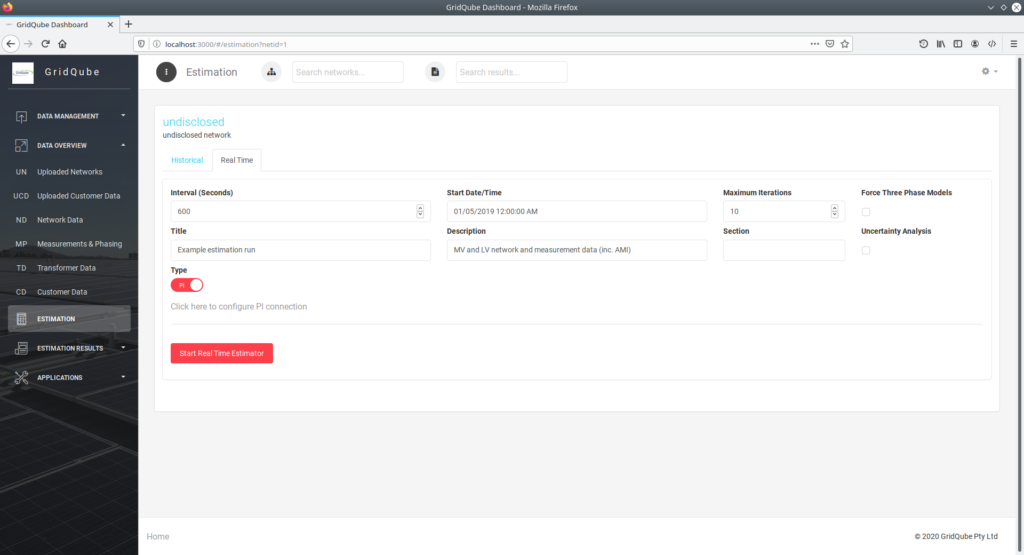
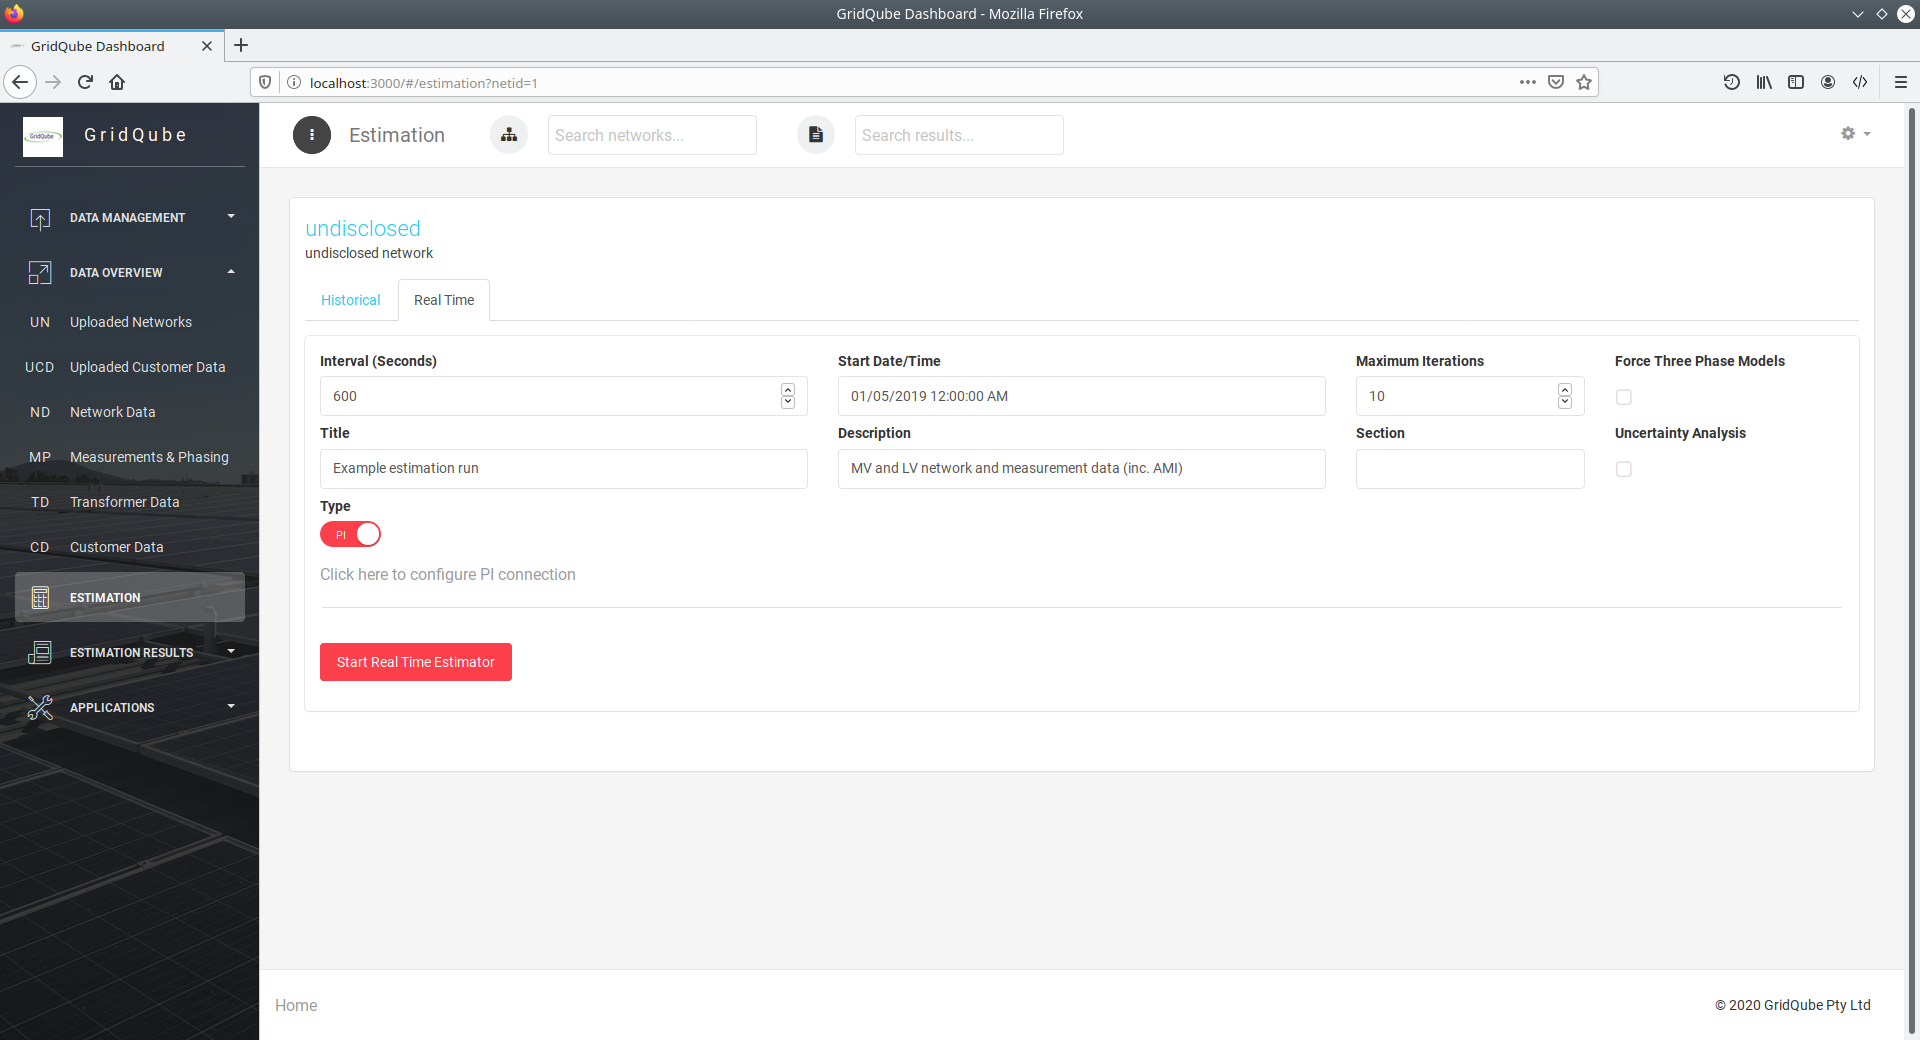
Control for real-time estimation 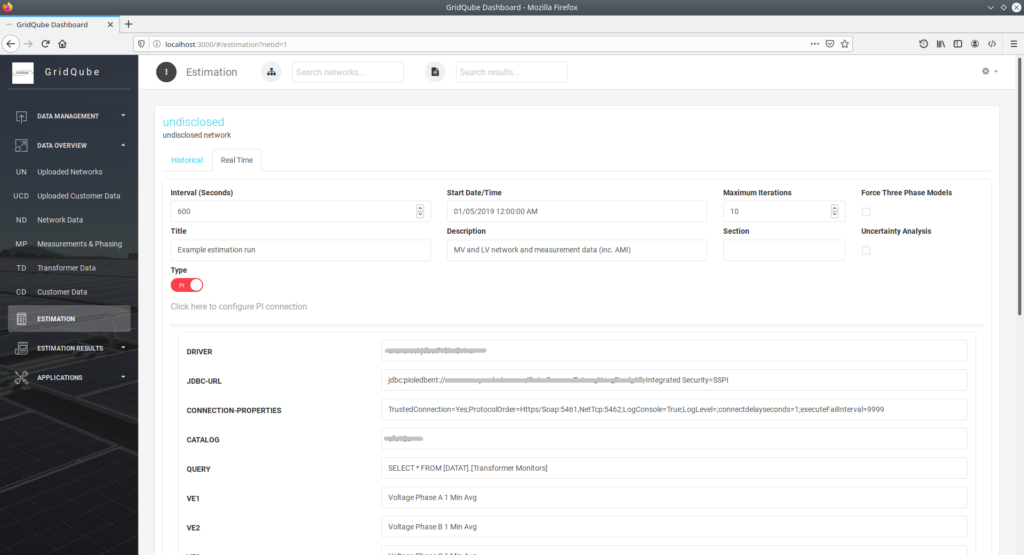
OSISoft PI connection settings for real-time estimation 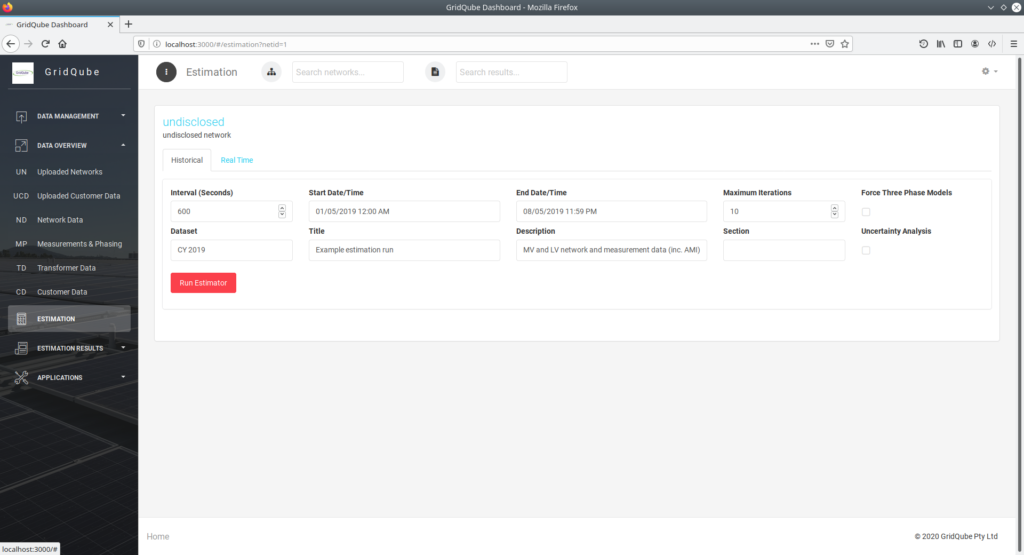
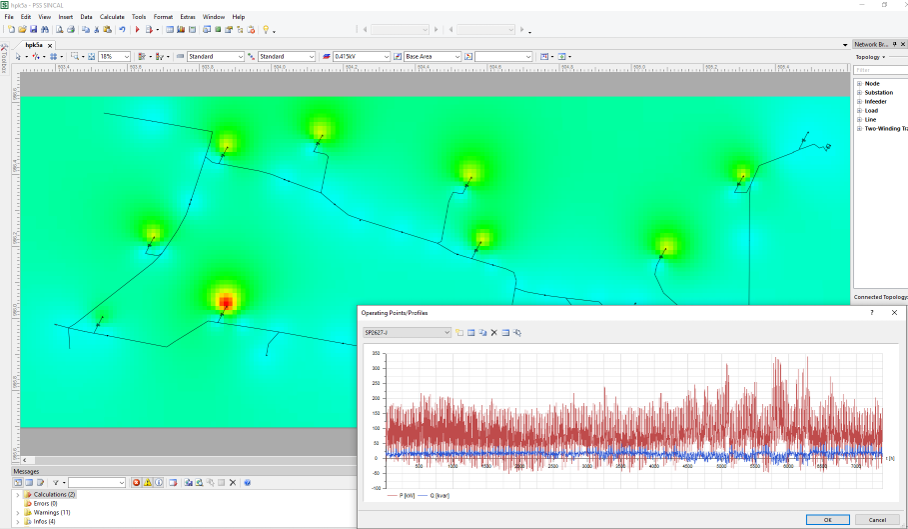
Control for estimation using recorded data


Measurement Data Overview
To provide an overview of the available measurement data and to support the identification of possible measurement data issues, GridQube CORE offers a measurement data inspection view which also allows basic mitigative actions like blinding out unreliable measurement data and correct phase associations.


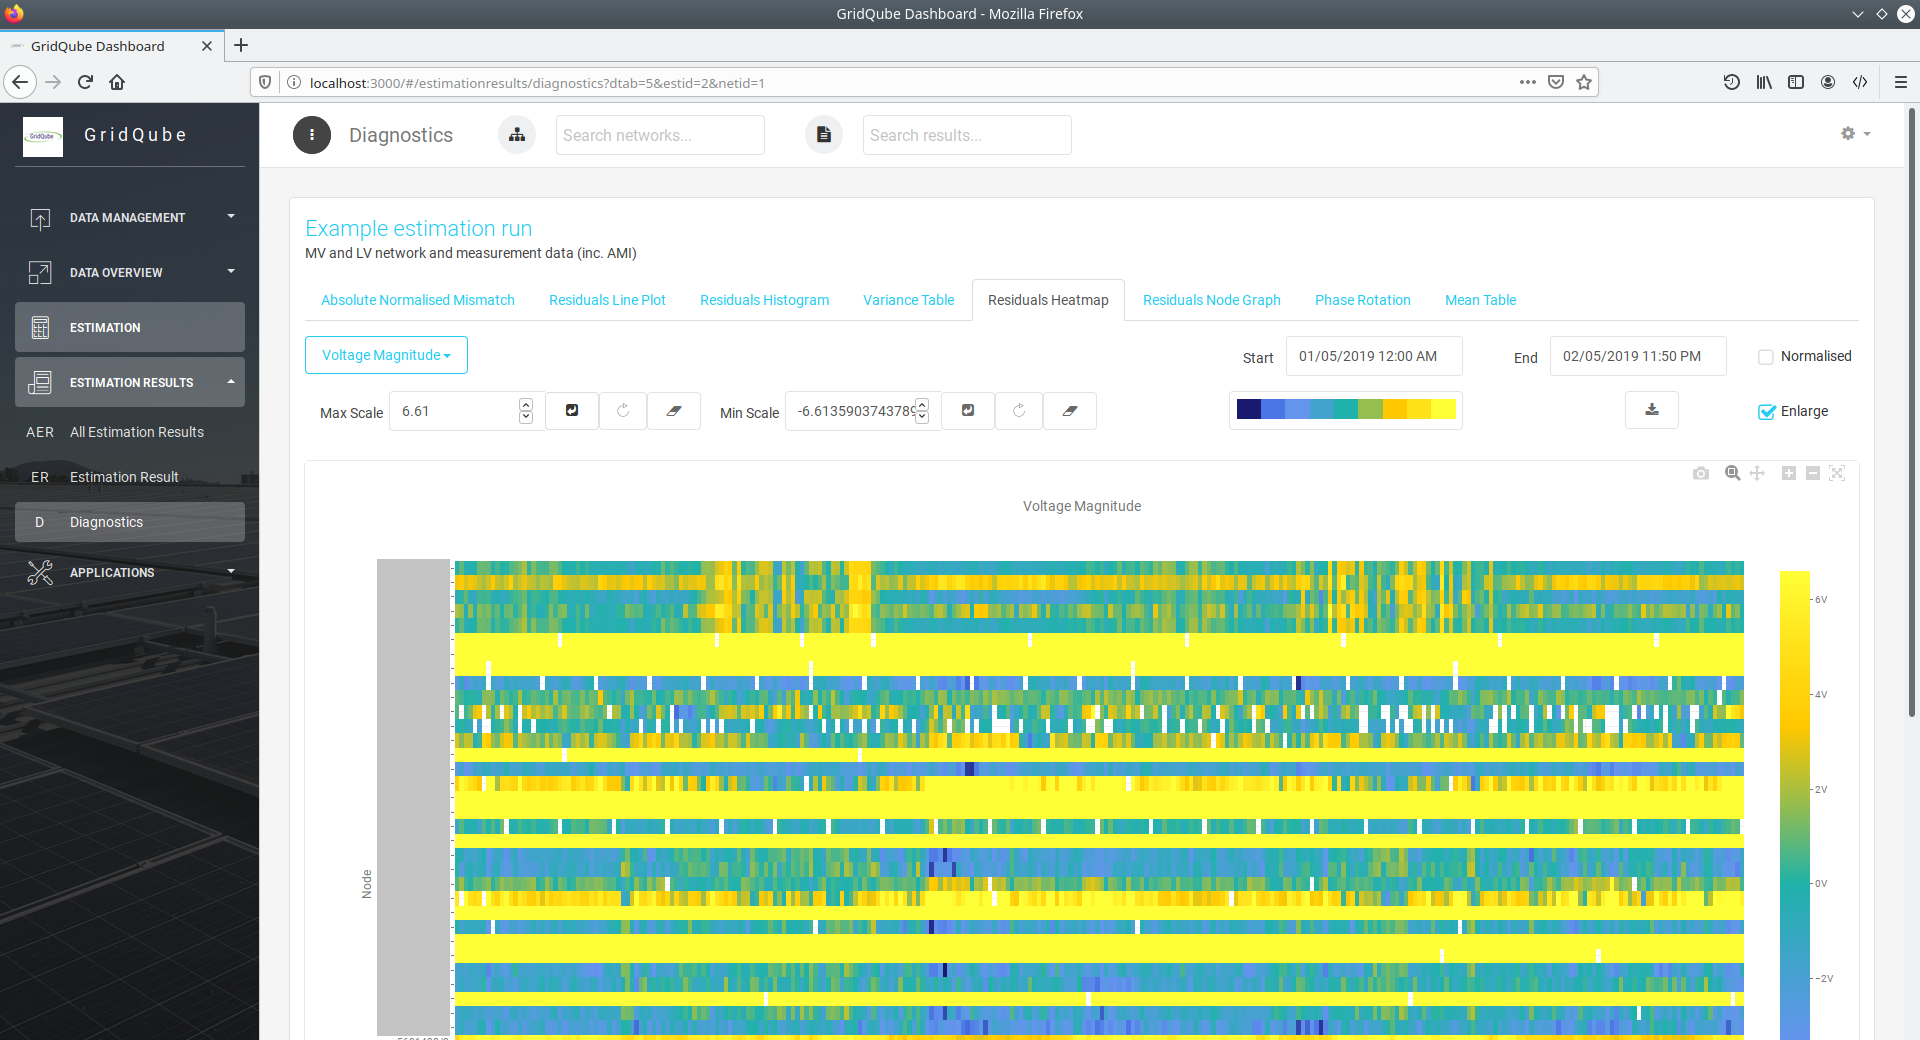
Estimation Diagnostics
To assess the health of estimation runs GridQube CORE includes a range of diagnostic tools. Different aspects of an estimation run can be analysed and common data quality issues identified. The most important diagnostic tools are the number of iterations required to estimate each timestep and the residual error (the discrepancy between provided measurement data and their corresponding best estimate considering all other available measurement data).
These diagnostic tools allow identification of provided measurement data that is in contradiction to the majority of other provided measurement data (bad data), but also likely network model issues, like incorrectly recorded transformer tap positions and incorrect phase information for measurements. In many cases such network model and phasing errors can be identified to the point that they can be corrected based on the residual analysis.


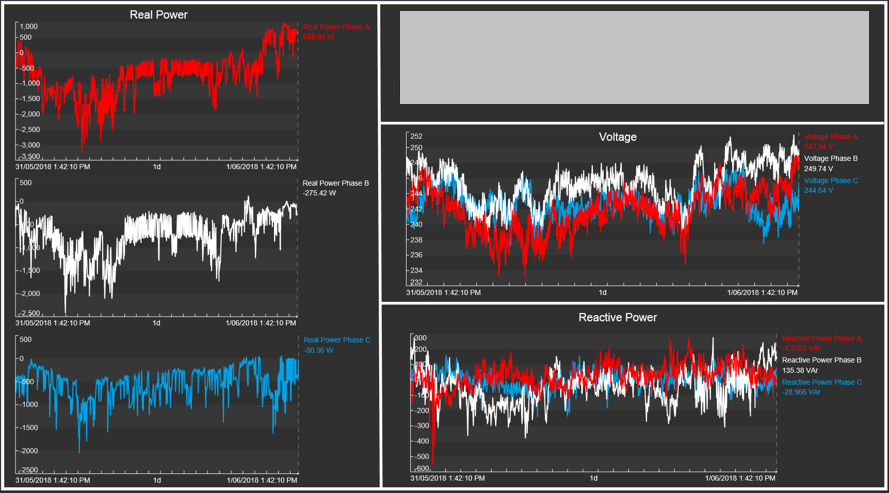
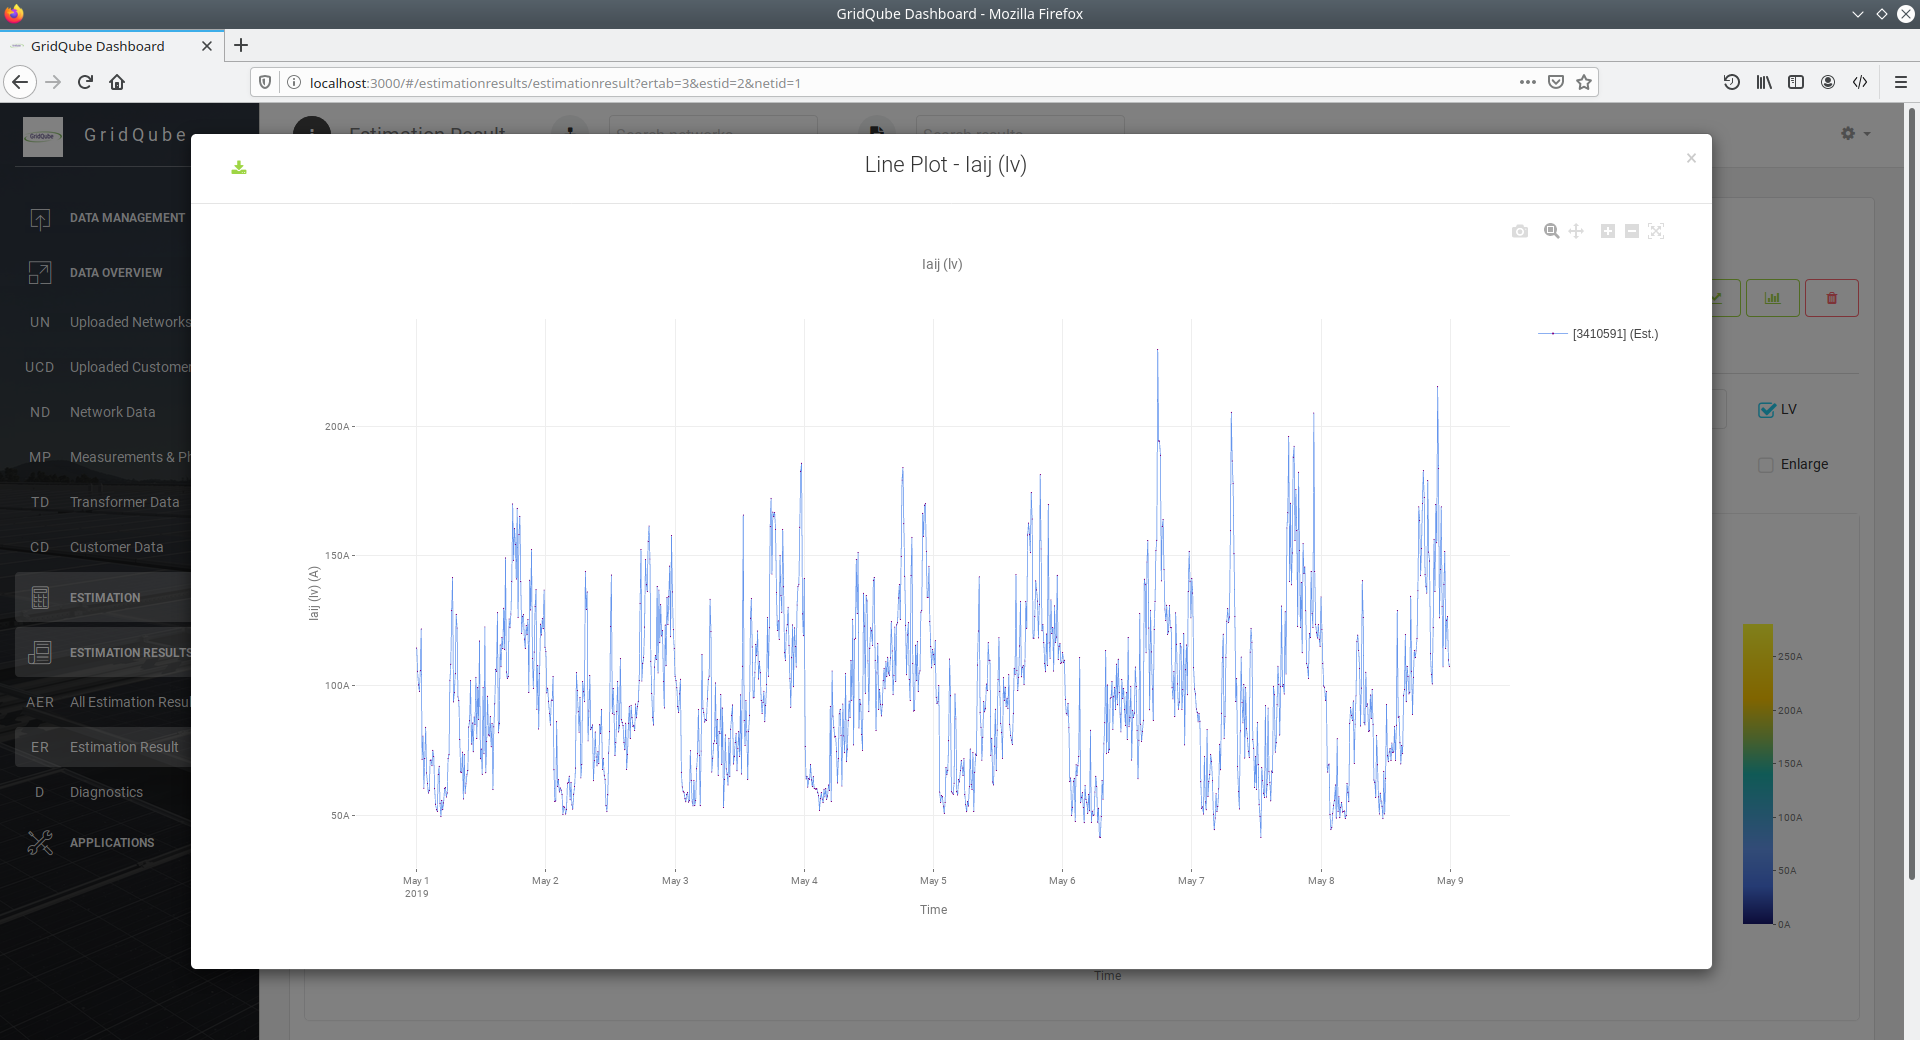
Estimation Result View
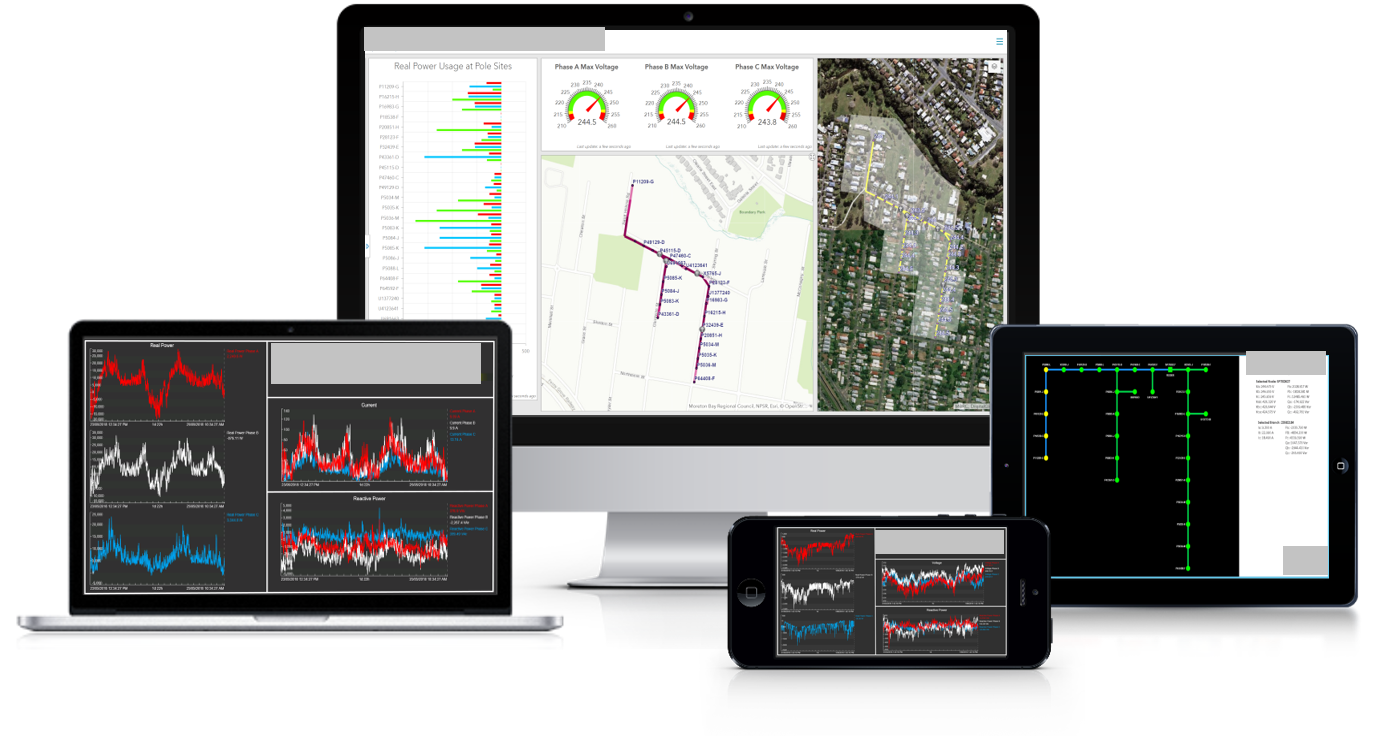
GridQube CORE provides complete network visibility for every timestep and is able to calculate any operational steady-state parameter from the obtained solution. A standard range of operational parameters are available for visual inspection in the Estimation Result view, where they can be visualised as heat maps, time series and histograms for statistical analysis.


IT Backend and Process Integration
GridQube CORE is built around an internal data storage realised using a relational Database Management System (DBMS). This offers the opportunity to interface with GridQube CORE in multiple different ways.
Direct DBMS access allows other IT Systems and processes to access result data straight from GridQube CORE’s internal DBMS for further analysis, distribution and visualisation. Examples include exports into OSIsoft PI and ArcGIS ESRI.
WebAPI access allows light-weight client access to GridQube CORE’s result data by offering a pre-processing layer and removing the need to a direct DBMS connection.
Dashboard exports allow a user to received result data in a pre-defined format ready to be used following tasks and processes without thefurther need for connectivity to GridQube CORE. Examples include exports into Power Flow Analysis packages, CSV and SQLite file exports.